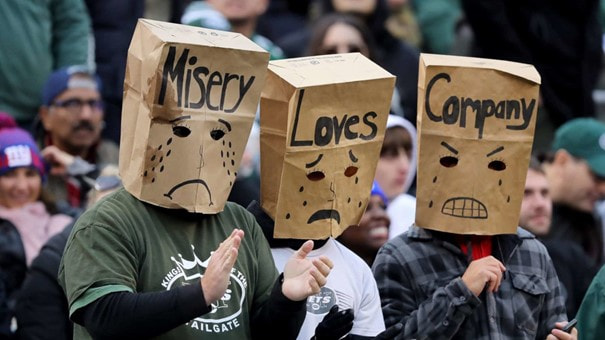
Jets Named America’s Most Embarrassing Franchise in New Blowout Study

We analyzed 50,000+ games from 2015–2024 across the NFL, NBA, MLB, and NHL to find the franchises that got embarrassed the most.
The worst? The New York Jets, who were blown out 36 times in the past decade — that’s more than two full seasons of football.
And the NFL — the league that prides itself on parity — had the most lopsided results, with blowouts in 1 of every 5 games, compared to 1 in 8 in MLB.
Quick Highlights
- 🏆 New York Jets (NFL) — 36 blowouts, the highest rate of any franchise in America (22% of games).
- 🛡️ Baltimore Ravens (NFL) — Only 5 blowout losses in 10 years, the hardest team in America to embarrass.
- 📊 NFL Leads All Leagues in Blowouts — 1 in 5 games ended ugly, compared to 1 in 8 in MLB.
America’s 20 Biggest Blowout Victims (2015–2024)
| Rank | Team | League | Blowout Losses | Blowout Loss Rate |
|---|---|---|---|---|
| 1 | New York Jets | NFL | 36 | 21.95% |
| 2 | New York Giants | NFL | 32 | 19.51% |
| 3 | Miami Dolphins | NFL | 30 | 18.29% |
| 4 | Jacksonville Jaguars | NFL | 29 | 17.68% |
| 5 | Carolina Panthers | NFL | 28 | 17.07% |
| 6 | Anaheim Ducks | NHL | 92 | 11.22% |
| 7 | Portland Trail Blazers | NBA | 91 | 11.10% |
| 8 | Orlando Magic | NBA | 88 | 10.73% |
| 9 | San Jose Sharks | NHL | 85 | 10.37% |
| 10 | Phoenix Suns | NBA | 84 | 10.24% |
| 11 | Charlotte Hornets | NBA | 83 | 10.12% |
| 12 | Washington Wizards | NBA | 81 | 9.88% |
| 13 | Ottawa Senators | NHL | 79 | 9.63% |
| 14 | Montreal Canadiens | NHL | 78 | 9.51% |
| 15 | Detroit Red Wings | NHL | 77 | 9.39% |
| 16 | Chicago White Sox | MLB | 150 | 9.26% |
| 17 | Baltimore Orioles | MLB | 144 | 8.89% |
| 18 | Detroit Tigers | MLB | 140 | 8.64% |
| 19 | Colorado Rockies | MLB | 139 | 8.58% |
| 20 | Philadelphia Phillies | MLB | 128 | 7.90% |
NFL Leads All Major Leagues in Blowouts
| League | Blowouts | Blowout Rate | Blowout Ratio |
|---|---|---|---|
| NFL | 594 | 21.57% | About 1 in every 5 games |
| NBA | 1,976 | 15.40% | About 1 in every 7 games |
| NHL | 1,953 | 15.34% | About 1 in every 7 games |
| MLB | 3,140 | 13.56% | About 1 in every 8 games |
The NFL is the clear outlier. More than 1 in 5 games end in a blowout, compared to just 1 in 8 in MLB. The NBA and NHL sit in the middle, with roughly 1 in 7 games turning lopsided.
Why NFL Blowouts Happen More
- Shorter schedules mean higher stakes. With just 16–17 games a season, a mismatch stands out more than in 162-game MLB slogs.
- Scoring swings are brutal. Two quick turnovers can create a 14-point gap in minutes.
- Roster gaps matter. A weak QB, bad line, or injured defense can sink a team for weeks, unlike the NBA where one star can still carry the team.
NFL Ratings Keep Climbing Despite Blowouts
Blowouts have not hurt the NFL’s bottom line. The league continues to grow, dominate TV ratings, and sell out stadiums. Even when games are over by halftime, America keeps watching — proof that the NFL’s grip on fans is stronger than the scoreboard.
The Hardest Teams to Blow Out
Not every team lived in the Factory of Sadness. These four proved nearly impossible to blow out in the last decade:
- Baltimore Ravens (NFL) — 5 blowout losses in 164 games (once every two seasons).
- Boston Celtics (NBA) — 32 blowouts in 820 games (one of the NBA’s steadiest contenders).
- Los Angeles Dodgers (MLB) — 62 blowouts in 1,620 games (consistently competitive night after night).
- Carolina Hurricanes (NHL) — 40 blowouts in 820 games (quietly one of hockey’s most resilient teams).
Methodology
We analyzed 50,000+ regular-season games from 2015–2024 across the NFL, NBA, MLB, and NHL. Blowouts were defined by league standards:
- NFL = 17+ points
- NBA = 20+ points
- MLB = 7+ runs
- NHL = 4+ goals
For the final ranking, we took the top 5 most blown out teams from each league (20 teams total) to compare franchises across sports on the same scale. Teams were ranked by percentage of blowout games, but frequencies (“1 in every X games”) are used in the narrative for clarity.
Fair Use
You may share this data for non-commercial purposes. Please credit Betting.us with link as the source.